


How To Use BetQL Web
Highlighting the features of a BetQL subscription on our web interface

Identifying an edge is one of the most difficult aspects of sports betting. Luckily, BetQL subscribers have a full arsenal of tools to utilize on our web interface.
Our best bet star ratings, public betting data, sharp betting data, line movement data, stat-filled game pages and exclusive sportsbook offers make up the full suite.
Best Bet Dashboard

Our model’s best bets identify the most valuable wagers a bettor can make on a given slate.
Our model projects team performance and takes into account player performance, matchups, weather and injuries. From there, we set our own line, compare it with Vegas and assign a star rating to each spread, moneyline and over/under bet.
Five-star bets are the most valuable bets, followed by four-star bets and so on. The goal of the star ratings model is to make betting as straightforward as possible. The 5-star bets are the best bets because the model indicates a significantly different outcome relative to the current sportsbook line. Conversely, 1-star bets indicate a projected line that is very similar to the sportsbook line — typically a losing proposition for a bettor in the long run.
Find out more information about our best bets!
Public Betting Dashboard
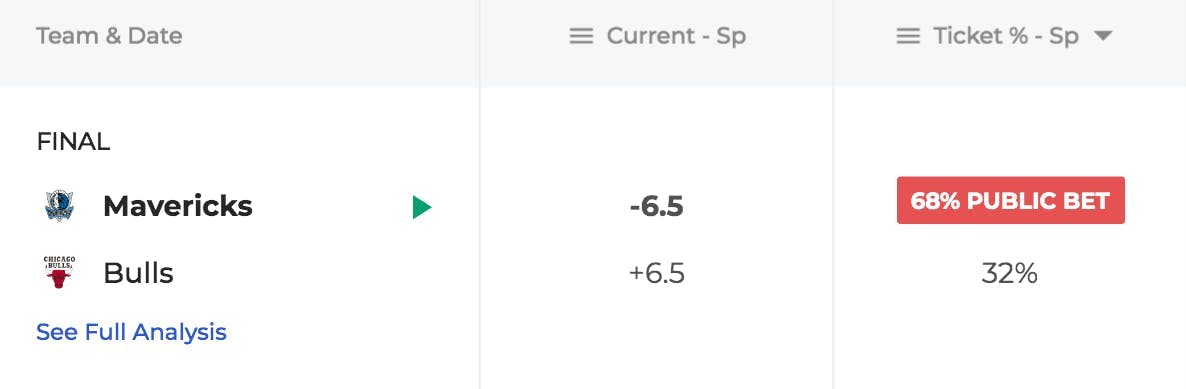
Public data tells you what side of a bet the general public is betting on.
Our public betting dashboards display the public ticket percentage for spread, moneyline, over/under and first-half bets provided directly by sportsbooks. On BetQL, “ticket %” refers to the percentage of total bets that were wagered on a particular outcome. To be clear, this should not be confused with total money or handle, but rather the percentage of total bets wagered on a particular outcome.
Betting against the public is a commonly deployed strategy because novice bettors tend to overreact to news like injuries or suspensions. When do you fade the public? When 70% of public bets are wagered on one side of an outcome, betting on the other side is a proven long-term winning strategy. At times, there’s no doubt that universally betting with the public can lead to short-term success. However, it’s not a winning long-term strategy. Therefore, taking a look at where the public is leaning and comparing it to our best bets and sharp data is highly suggested.
Find out more information about our public betting data, including sport-by-sport breakdowns.
Sharp Betting Dashboard
Sharp data tells you which side of a bet the pros are betting on.
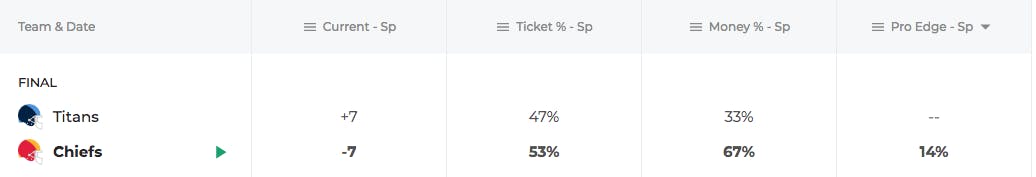
On our web dashboards, we refer to sharp bets as the "Pro Edge". The higher this number is, the more sharp bettors are favoring the bet over the public. The lower this number is, the more sharp bettors are aligned with the public.
Pro Edge = Total Money % - Total Ticket %
In the example above, 67% of total money was wagered on the Chiefs while 53% of the total bet slips backed Kansas City. That resulted in a 14% Pro Edge. Since professional bettors tend to wager higher amounts of money than casual bettors, sharp data is a valuable tool to use. In this case, expert bettors leaned more towards the Chiefs than public bettors did.
Sharp bettors are considered pros due to the fact that they typically wager the most money and are usually responsible for moving lines. Sharps usually get heavy action on their targeted bets soon after odds are released. Having access to those targets is extremely powerful. While betting with the sharps doesn’t work every single time, if you consistently make informed bets by utilizing sharp data, your bankroll will most likely grow over time.
Find out more information about our sharp betting data, including sport-by-sport breakdowns.
Line Movement Dashboard

Line movement occurs when odds move in one direction or the other. Oddsmakers move lines for a variety of reasons, including betting activity, strategy against the public, injuries, scratches, weather and more in order to make the game enticing to bet for both sides, which is their ultimate goal.
Line movement data usually corresponds with sharp data since heavy money on one side of a line usually shifts the odds. Accessing this information with the click of a button is crucial, especially before shopping around for the best-possible line.
Find out more information about line movement data, including sport-by-sport examples.
Game Pages

We feature game pages for every in-season sport. These pages show our model’s best bets, our model’s projections, lines from reputable sportsbooks, sharp data, public data, line movement data, a sortable schedule filled with betting information, relevant team betting trends, lineups and injuries. This is a one-stop shop if you’re interested in betting on a specific game.
Sportsbook Offers

Not only do we feature exclusive offers from our sportsbook partners, but we also rate and review them for our subscribers. Sort by your state. Check out what offers currently exist. See our corresponding 1-5 star offer rating. Read our quick review. Then, take advantage of the deal!
View your exclusive sportsbook offers!
Learn More About BetQL
Stories you might also like
See All


